Recently I have been playing a lot with Tableau, and I decided to extract data from my Google Analytics Account in regard to one of my blogs and visualize the extracted data. Today I want to share my findings. Every visualization gives us some insights into the data. Data connection with Google Analytics opens pretty quick. You can select up 7 dimensions and 10 measures to work with.
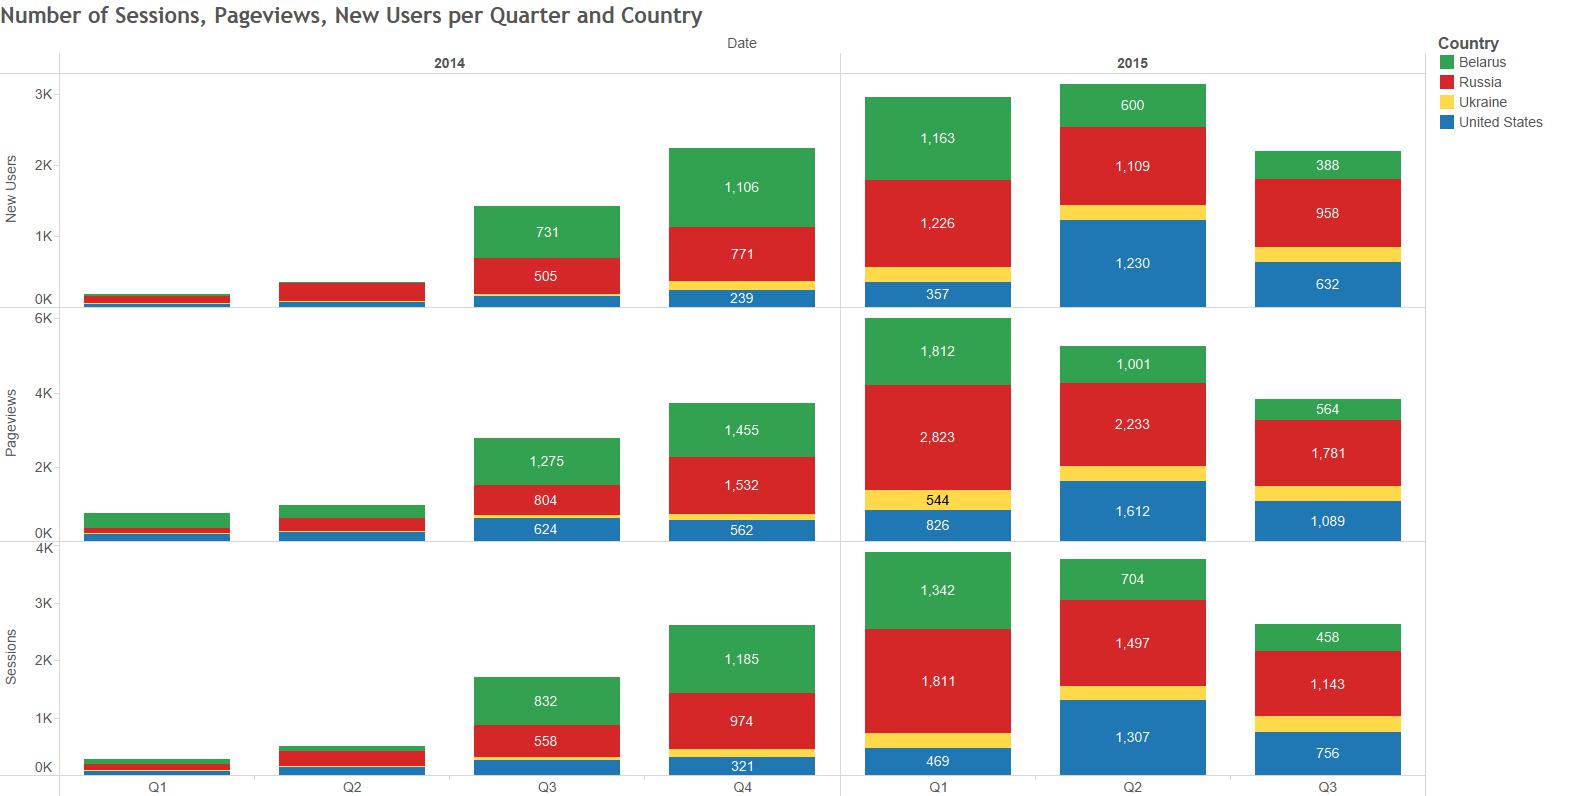
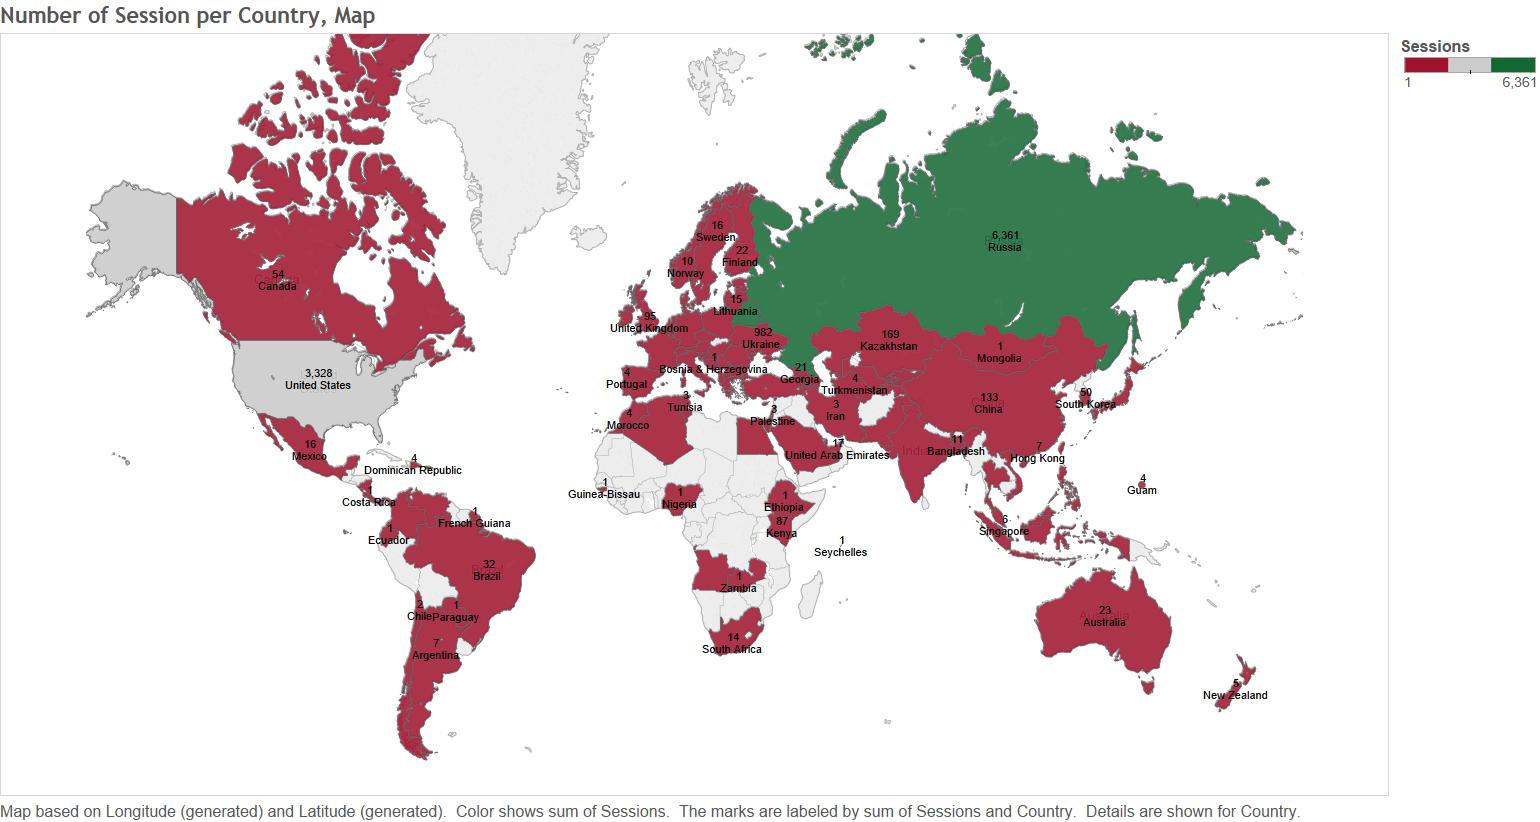
The blog is about traveling, and it’s in Russian. Its main audience is in Russia, Eastern Europe, and United States. Below you can see number of sessions, pageviews, and new users by country and year quarter as well as a map.
1
2
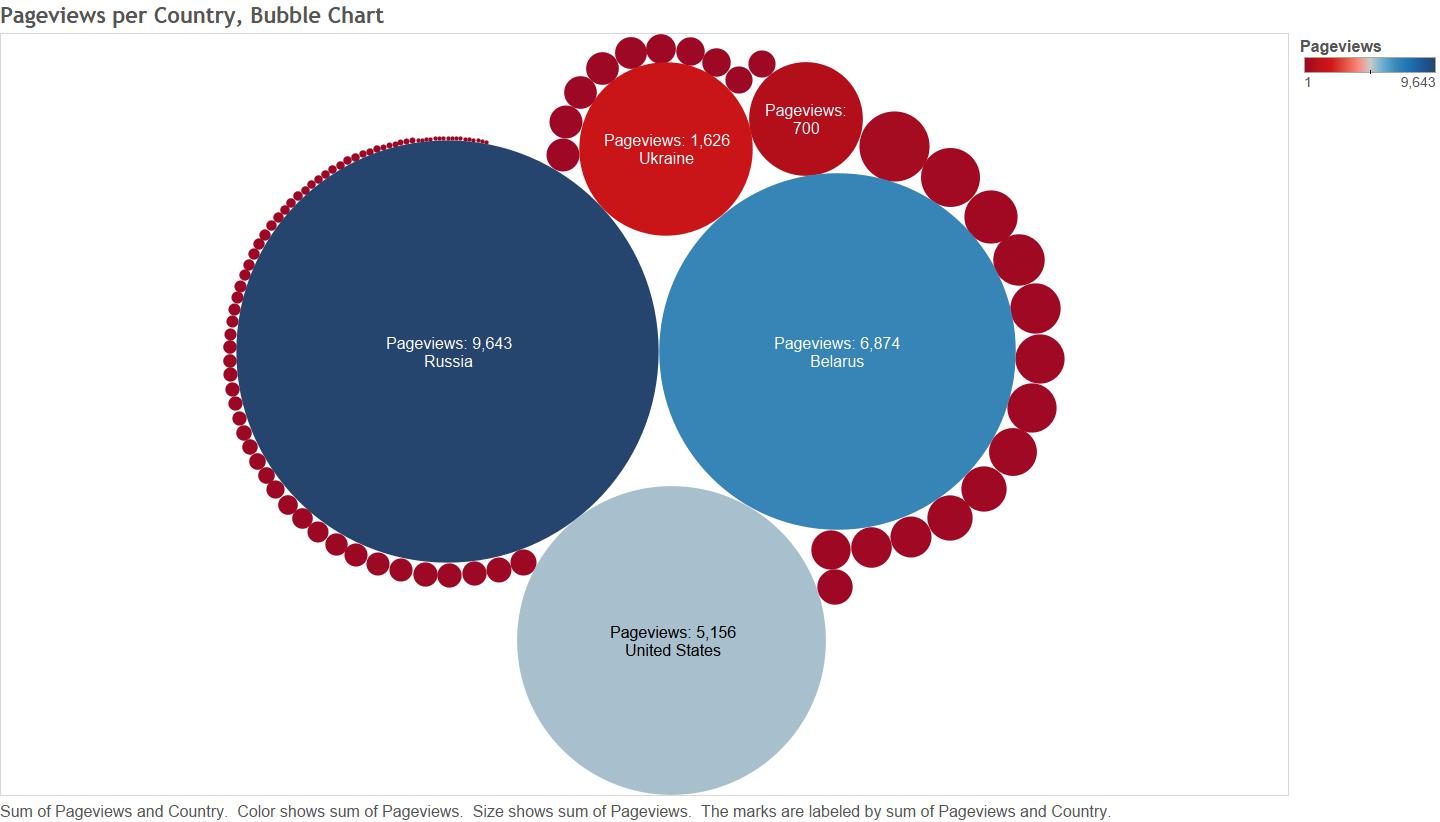
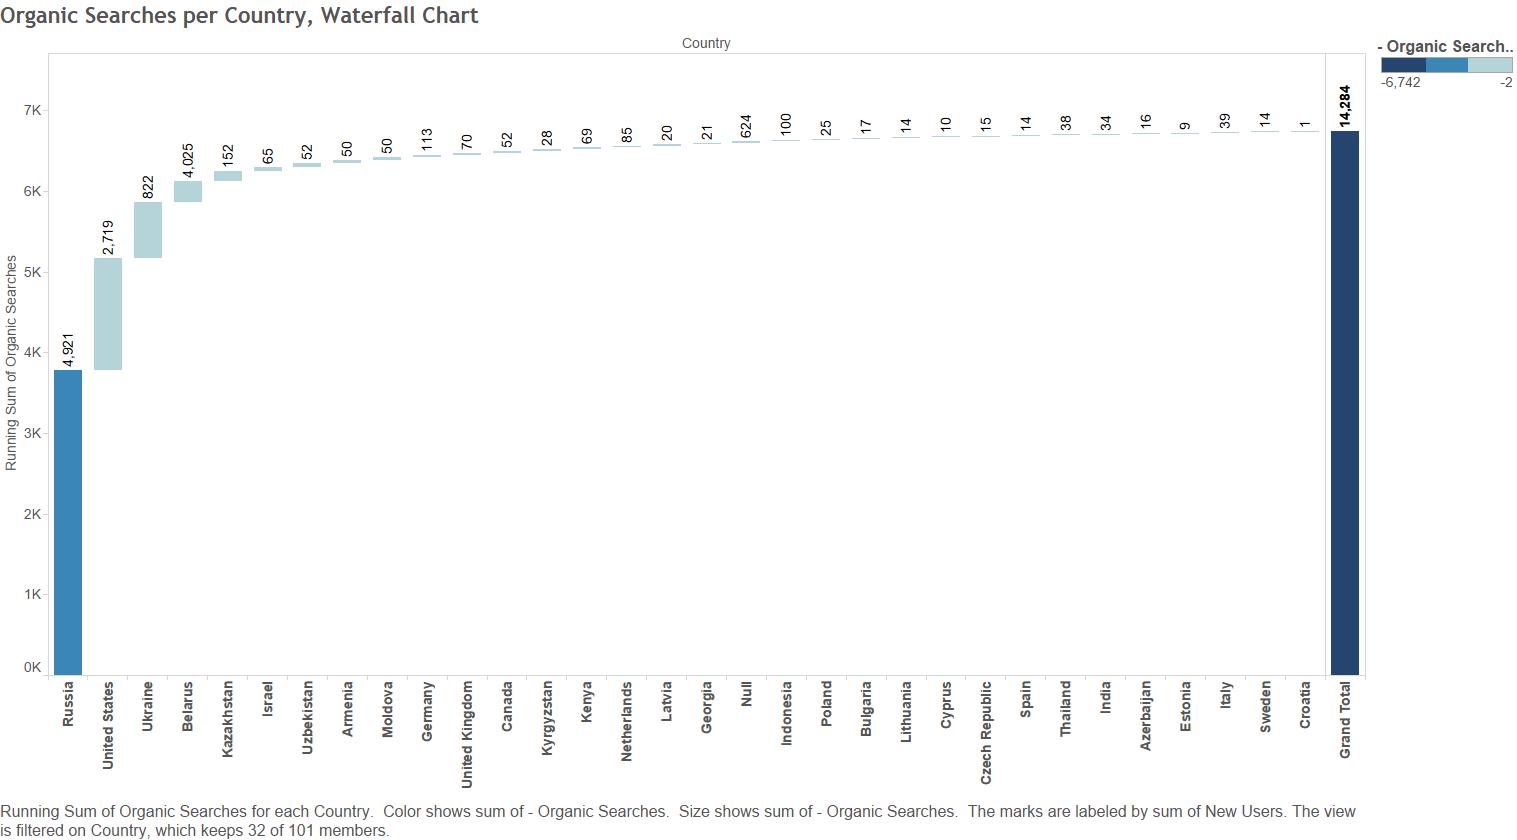
The bubble and waterfall charts below is basically showing the same information, but I like how they look 🙂 The waterfall chart shows the number of organic searches by country. We can see that although the U.S. is the third country by number of pageviews, it’s the second country by the number of organic searches. And Belarus where I am from is the second by number of pageviews, but the forth by the number of organic searches. I guess my friends and family from Belarus influenced this result.
3
4
Continue reading ‘Turn Google Analytics Numbers into Actions with Tableau’ »