The general idea of the model is to determine the financial feasibility of a Multi-family Building Acquisition Project.
The building is located in Los Feliz, Los Angeles. It has five units, four two-bedroom and a one-bedroom unit. Follow the link to see more information: Multi-family building in Los Feliz.
Multi-family buildings are usually purchased with the intent to lease and produce income to the owner as well as with the expectation of price appreciation of the property.
Assumptions of the model are:
- Monthly rent
- Expenses
- Capitalization Rate
- Holding Period and
- Vacancy and Non-payment Rate
Special attention should be given to these assumptions. For example, with the small changes in the Capitalization Rate or Vacancy Rate, the overall profitability of the project may change substantially.
Let’s take a closer look at all tabs of the Excel Model. The “Cover” tab is the first tab and contains my contact information and the Table of Content. The second tab “Units” gives more info about the building’s units, how many bedrooms and bathroom each unit has, actual and projected monthly rent.
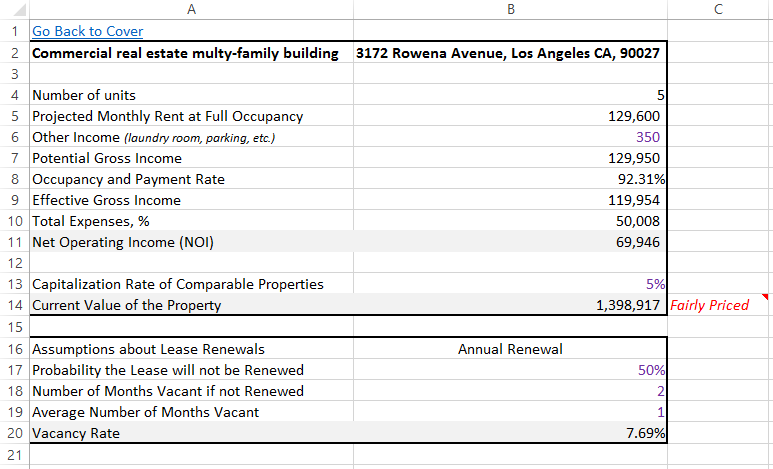
The “Current Value Estimation” tab is used to estimate the intrinsic value of the property by applying the income approach. The value estimated with this approach is the present value of the expected future income from the property, including proceeds from resale at the end of a typical holding period. The value of the property determined with the income approach depends on the investor’s required rate of return to invest in the property. I assume the building is considered to be fairly priced if its price is within five percent of its estimated value.
Based on the analysis of the building under consideration, we can conclude that the building is fairly priced under the assumption of receiving a market level of rent and overpriced in case of receiving current level of rent. Four out of five rental units have stabilized rent which makes them substantially less profitable. Although, in case of using a stabilized level of rent in the model, we need to lower the vacancy rate since people will keep their lease agreements much longer given lower rent they have to pay in comparison with market prices.
The annual allowable rent increase in Los Angeles is 3%. The links to determine a Property Tax Area and Rate are provided as well which is 1.218651% in our case. I assume that the market value of the building for the purpose of Property Tax assessed by the local government will be equal to its purchase price.
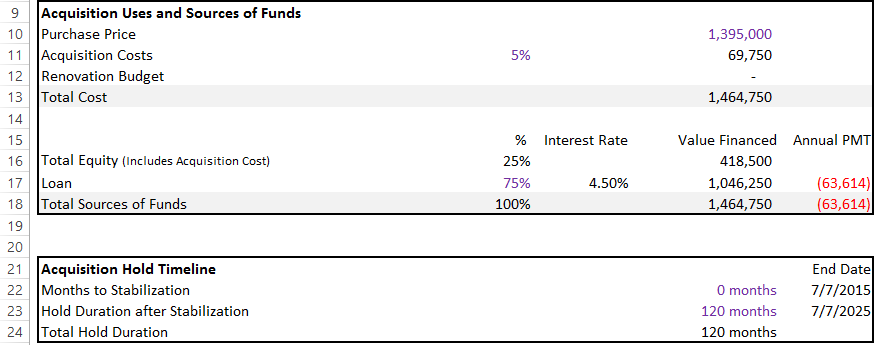
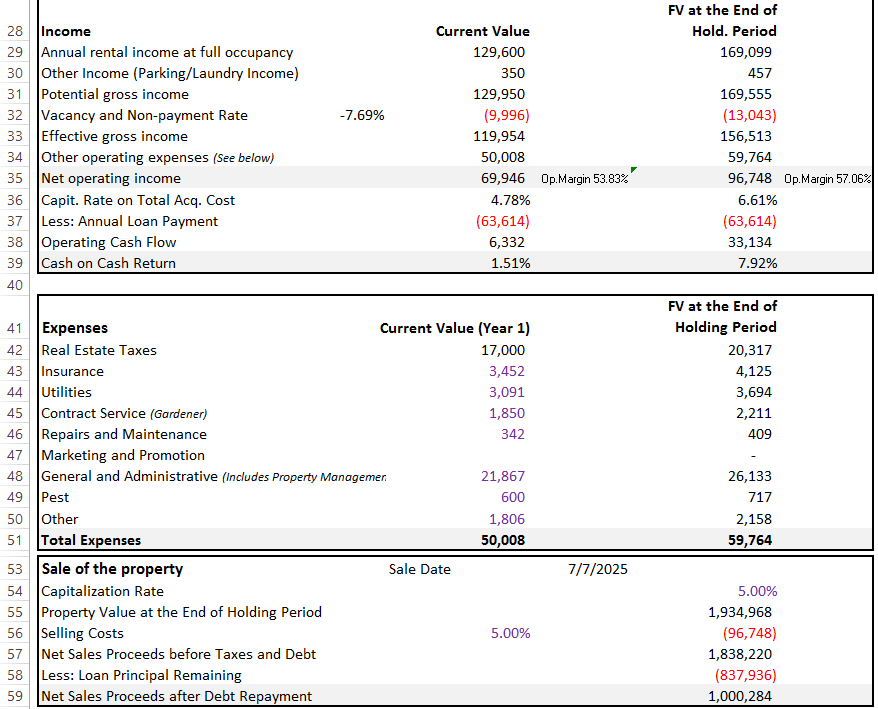
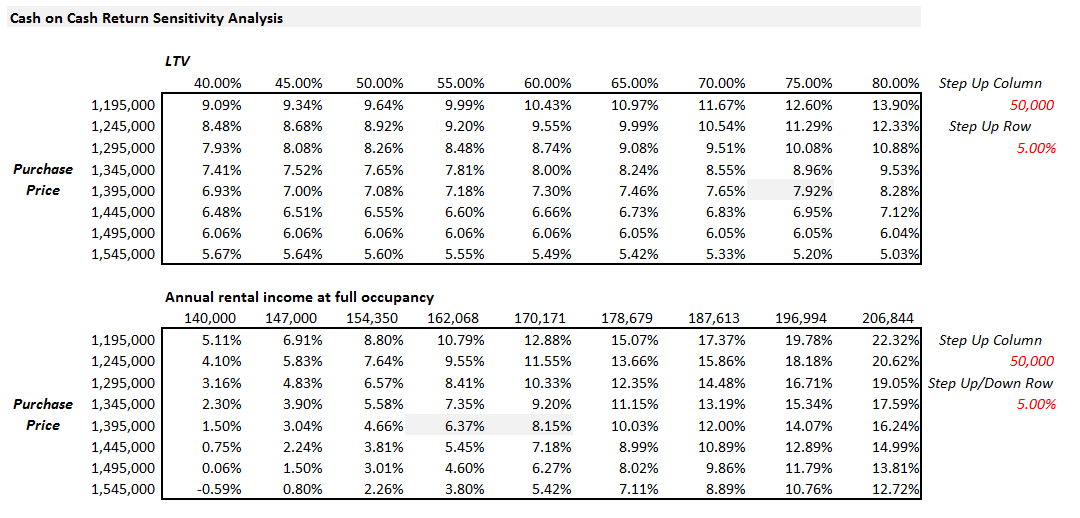
The “Acquisition Model” tab is a useful tool for quick analysis of the building under consideration. It gives detailed info in regard to the Acquisition Uses and Sources of Funds, Acquisition Hold Timeline, Projected Annual Rental Income, and Expenses. As a result, we get NOI, Cash on Cash Return, and Net Sales Proceeds after Debt Repayment. We also present sensitivity analysis in relation to Cash on Cash Return and Net Sales Proceeds after Debt Repayment.
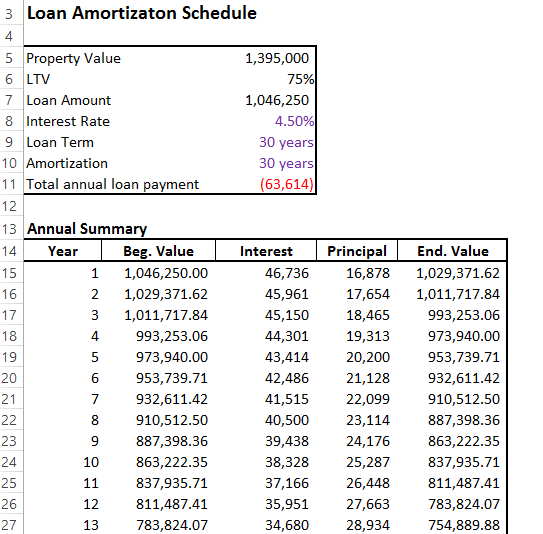
The “Loan Calculation” tab gives us info how much principal the investor will have to repay at the end the holding period to the lender.
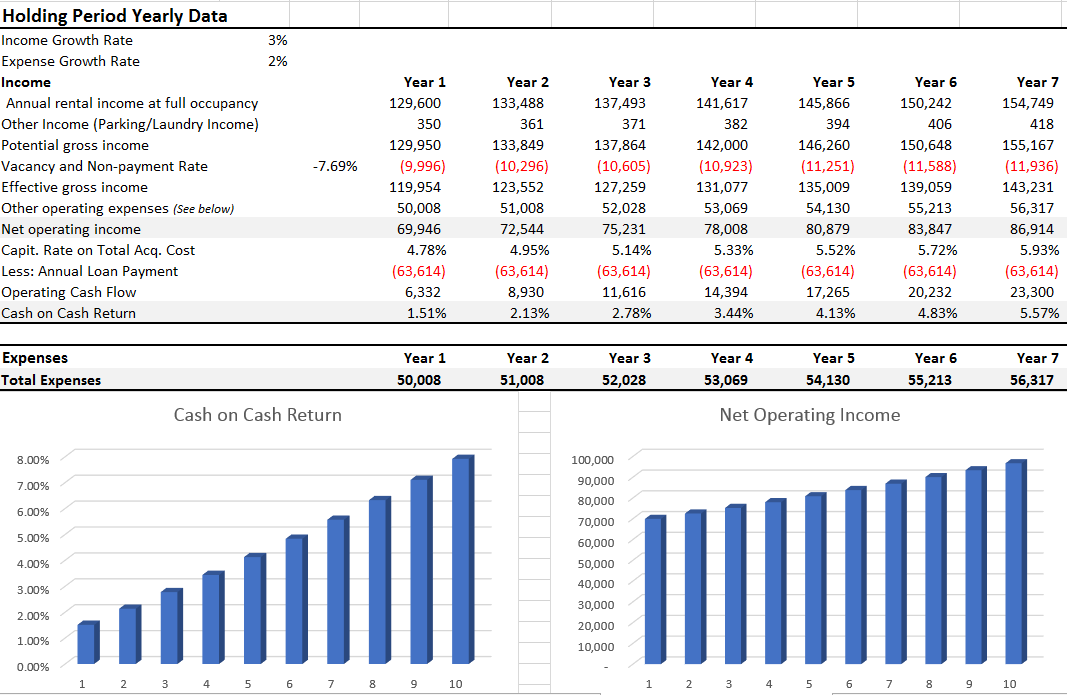
The “Holding Period Yearly Data” gives us yearly info regarding Income, Expenses, and Cash on Cash Returns. We can see how profitability changes over time.
Based on the analysis of the building under consideration, we can conclude that the building is fairly priced under the assumption of receiving a market level of rent and overpriced in case of receiving current level of rent. Four out of five rental units have stabilized rent which makes them substantially less profitable. Although, in case of using a stabilized level of rent in the model, we need to lower the vacancy rate since people will keep their lease agreements much longer given lower rent they have to pay in comparison with market prices.
Given 75% LTV rate and 4.5% APR on the loan, Cash on Cash return will be 1.51% at the end of the 1st year and 7.92% at the end of the Holding Period of 120 months. Net Sales Proceeds after Debt Repayment will be $1,000,284.
